The missing fundamental
- Publish Date
- Authors
- Dave Mosher
Music composition and production is a large part of my life outside of software development, so much so that I often find myself thinking of ways to draw parallels between the two. One such parallel that has stuck with me over the past 6 months or so is the concept of the missing fundamental.
A harmonic sound is said to have a missing fundamental, suppressed fundamental, or phantom fundamental when its overtones suggest a fundamental frequency but the sound lacks a component at the fundamental frequency itself.
When I first learned about this concept, I couldn’t help but think of how it applied to the work we do as software engineers. In the same way that skilled audio engineers can leverage the concept of the missing fundamental to improve the characteristics of sound, skilled software engineers can use a similar set of skills to improve the performance of applications.
This very concept of “missing fundamental” being reproduced based on the overtones in the tone has been used to create the illusion of bass in sound systems that are not capable of such bass. In mid-1999, Meir Shashoua of Tel Aviv, co-founder of Waves Audio, patented an algorithm to create the sense of the missing fundamental by synthesizing higher harmonics. Waves Audio released the MaxxBass plug-in to allow computer users to apply the synthesized harmonics to their audio files.
The fundamentals of software performance
Ali and I were recently tasked with improving the performance of a legacy codebase that was deployed on Heroku using Node.js, MongoDB, and Angular 1. One of our first steps in evaluating the performance of code is to do an audit of dependencies and configuration; this is a great starting point because it can often lead to simple fixes for performance issues, like updating a database ORM adapter that can query things more efficiently.
In this case an audit of dependencies didn’t yield much and we had to dive further into configuration on Heroku to really make sense of the performance challenge. Significant discovery number one was that the application was configured using Performance L dynos on Heroku (the most expensive and highest tier available). This seemed strange since it did not appear commensurate with the surface area of the application; its purpose was to sync data using Heroku scheduler to pull from SalesForce into MongoDB.
One of our first steps was to reduce the dyno size and monitor logs to see if the Performance L size was warranted.
Fundamental #1: Investigate
Heroku makes it pretty easy to peek at logs for your app, which is what we started with: heroku logs --tail -a td-client-slow-app. This yielded the following trace:
app[web.1]:
app[web.1]: <--- Last few GCs --->
app[web.1]:
app[web.1]: <--- JS stacktrace --->
app[web.1]:
app[web.1]: ==== JS stack trace ==========
app[web.1]:
app[web.1]: 0: ExitFrame [pc: 0x1374fd9]
app[web.1]: Security context: 0x01f9540008a1 <JSObject>
app[web.1]: 1: getOwnPropertyNames [0x1f954001251](truncated...)
app[web.1]: 2: getOwnPropertyDescriptors [0x3dffde9f7229]
[/app/node_modules/mongoose/lib/helpers/document/compile.js:159]
app[web.1]:
app[web.1]: FATAL ERROR: Ineffective mark-compacts
app[web.1]: near heap limit Allocation failed -
app[web.1]: JavaScript heap out of memory
(Note: The slug for this application was ~74mb, which didn’t seem overly large to warrant running out of memory on the lowest tier dyno Heroku provides. That dyno allocates up to 512mb of RAM, so we dug into the code path that led to the above stacktrace to gain some more information.)
Fundamental #2: Profile
Node.js has some pretty decent profiling tools for engineers who want to dive into performance profiling. TD-resident DevOps pro Micah showed me that you can add some flags to the node process on startup to influence how V8 manages garbage collection. This is useful if you aren’t getting consistency in your crashes and want to place constraints on the application runtime in order to suss out the source of the memory leak.
node --optimize_for_size --max_old_space_size=460 app.js
Artifically lowering the max heap size below what Heroku provisions for Standard dynos yielded the source of the leak was a method called getUsers which was responsible for querying a list of users and their permissions from MongoDB. Here’s a sample of what that code looked like as we first found it:
getUsers: function(req, res) {
  User.find({}, function(err, users) {
    var allUsers = users;
    var adminUsers = [];
    var corpUsers = [];
    var techUsers = [];
    var formalUsers = [];
    var searchUsers = [];
    users.forEach(function(user) {
      if(user.permissions.admin &&
         (user.permissions.admin.corpUsers ||
          user.permissions.admin.techUsers ||
          user.permissions.admin.formalUsers ||
          user.permissions.admin.searchUsers ||
          user.permissions.admin.superAdmin)) {
        adminUsers.push(user);
      }
      if(user.permissions.general.corpUsers) {
        corpUsers.push(user);
      }
      if(user.permissions.general.formalUsers) {
        formalUsers.push(user);
      }
      if(user.permissions.general.search) {
        searchUsers.push(user);
      }
      // this continued on for another 40 lines or so...
    })
  })
}
Node.js has performance tooling built-in that allows you to gain insight around memory and CPU usage, which is what we used next:
const { PerformanceObserver, performance } = require('perf_hooks')
const o = new PerformanceObserver((items) => {
  console.log(items.getEntries()[0]);
  performance.clearMarks();
})
o.observe({ entryTypes: ['measure']})
// to get the approx mem usage you can add this log line:
console.log(`
The script uses ~
${process.memoryUsage().heapUsed / 1024 / 1024}
MB
`)# Output
PerformanceEntry {
name: 'getUsers to res.status(200)',
entryType: 'measure',
startTime: 5486.524808,
duration: 6559.275542
}
The script uses ~ 456.143798828125 MBLooking at this code I couldn’t help but wonder if there was a more efficient way to query and aggregate this information.
Fundamental #3: Identify the missing fundamental
Returning to the idea of the missing fundamental, as audio engineers must ask themselves “what can I change about the frequencies in this mix in order to bring things into harmony?” the relevant question for software engineers is very similar: “what does this system need in order to bring harmony to its operation?”. In our case it was also helpful to consider that question in a historical context as “what fundamental were the original developers missing when they built this?”
In both cases, the answer for this application was how to query things more efficiently!
The getUsers method above was doing two things wrong; querying inefficiently for all the users in the system and then allocating large arrays to partition the data based on permissions. Once we understood the missing fundamental we had a path forward to try and optimize this poorly performing code: we should see if we can query things more efficiently. This is what we came up with using async/await and the MongoDB aggregation pipeline:
getUsers: async function(req, res) {
  const adminUsers = await User.aggregate([
    {
      $match: {
        $or: [
          { "permissions.admin.corpUsers" : { $eq: true }},
          { "permissions.admin.techUsers" : { $eq: true }},
          { "permissions.admin.formalUsers" : { $eq: true }},
          { "permissions.admin.searchUser" : { $eq: true }},
          { "permissions.admin.superAdmin" : { $eq: true }},
        ]
      }
    }
  ])

  const corpUsers = await User.aggregate([
    {
      $match: {
        "permissions.general.corpUsers" : { $eq: true }
      }
    }
  ])

  // ... etc...

  res.status(200).json({
    data: {
      adminUsers,
      corpUsers,
      ...
    }
  })
}
Once we had re-written and tested the query to make sure the output was the same, we re-ran our performance profiling to see what the difference was.
PerformanceEntry {
name: 'getUsers to res.status(200)',
entryType: 'measure',
startTime: 496079.094306,
duration: 270.1256
}
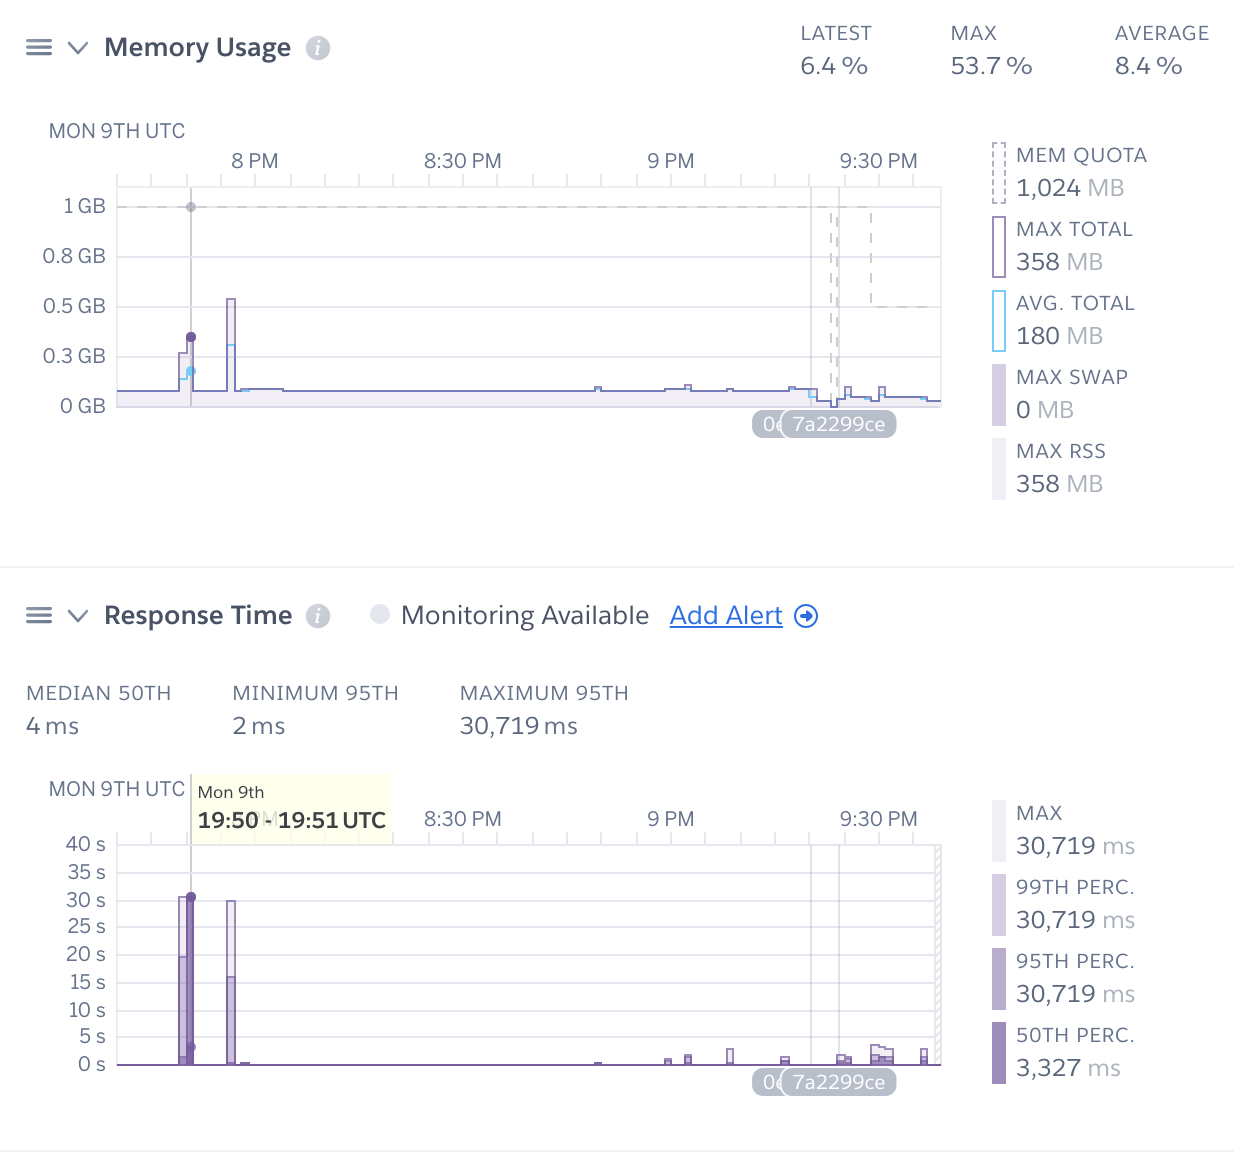
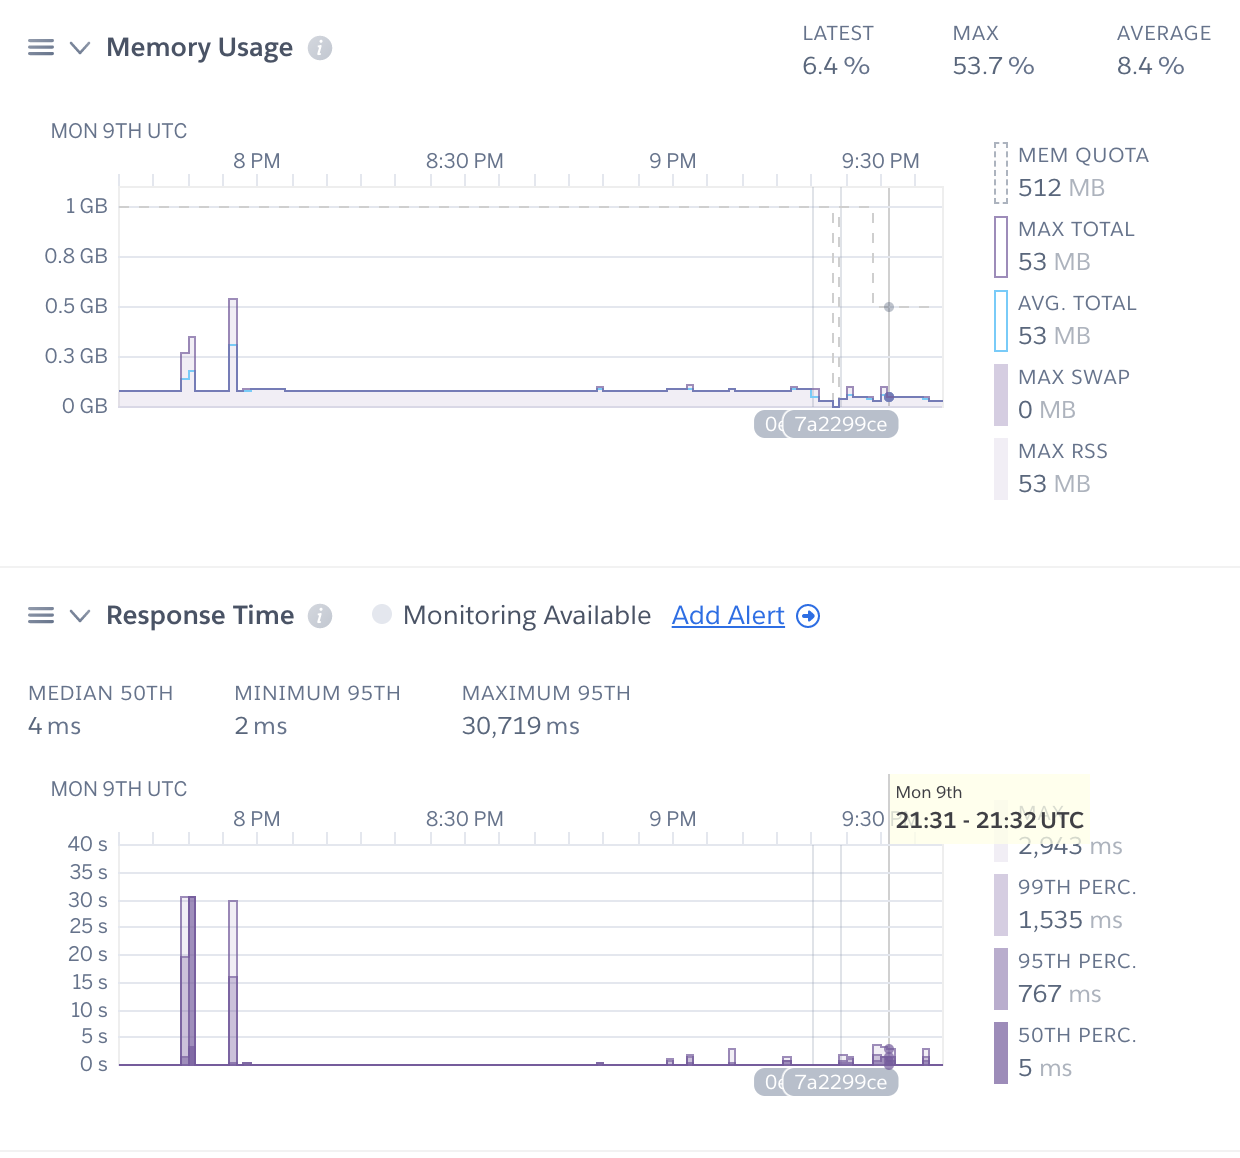
The script uses ~ 44.550048828125 MBUsing the Aggregation pipeline had yielded an order of magnitude less memory and CPU usage! Here’s a couple of screenshots from the Heroku dashboard for this app that show the before/after comparisons as well.
Before - request timeouts, and large amounts of memory consumption.
After - no timeouts, memory consumption reduced by a factor of 10.
Conclusions
If you find yourself in a similar situation evaluating the performance of some legacy code I would encourage you to think about asking questions around what the missing fundamental(s) are. Walking through investigate, profile, identify (rinse. repeat.) has been useful for me, and I hope it is for you!
If you’re interested in this type of work, you should reach out and say hi; we’re always looking to hire expert software engineers. :)

Dave Mosher
- Status
- Sleeper Agent
- Code Name
- Agent 007
- Location
- Ottawa, ON, Canada